How to spot a TikTok trend before it peaks
We followed 95 hashtag surges day by day. Five days out, the typical one was at 6% of its peak. The day after, it had lost almost two-thirds.
The standard advice is to catch a trend early. It is good advice with a practical problem: by the time a trend reaches your For You page, the people who started it have usually moved on. So we wanted to know what “early” actually looks like in the numbers, and how much of it you can see coming.
We took 3.72 million TikTok posts made between 15 July and 5 September 2026, found every hashtag whose daily posting suddenly jumped, and followed each one day by day from a week before its busiest day to a week after. 95 of those jumps held up as genuine surges, each with at least 20 different accounts posting on the peak day.
The short version: most of them gave almost no warning, and most were over almost as soon as they started. The ones that did give warning behaved differently in a way that matters.
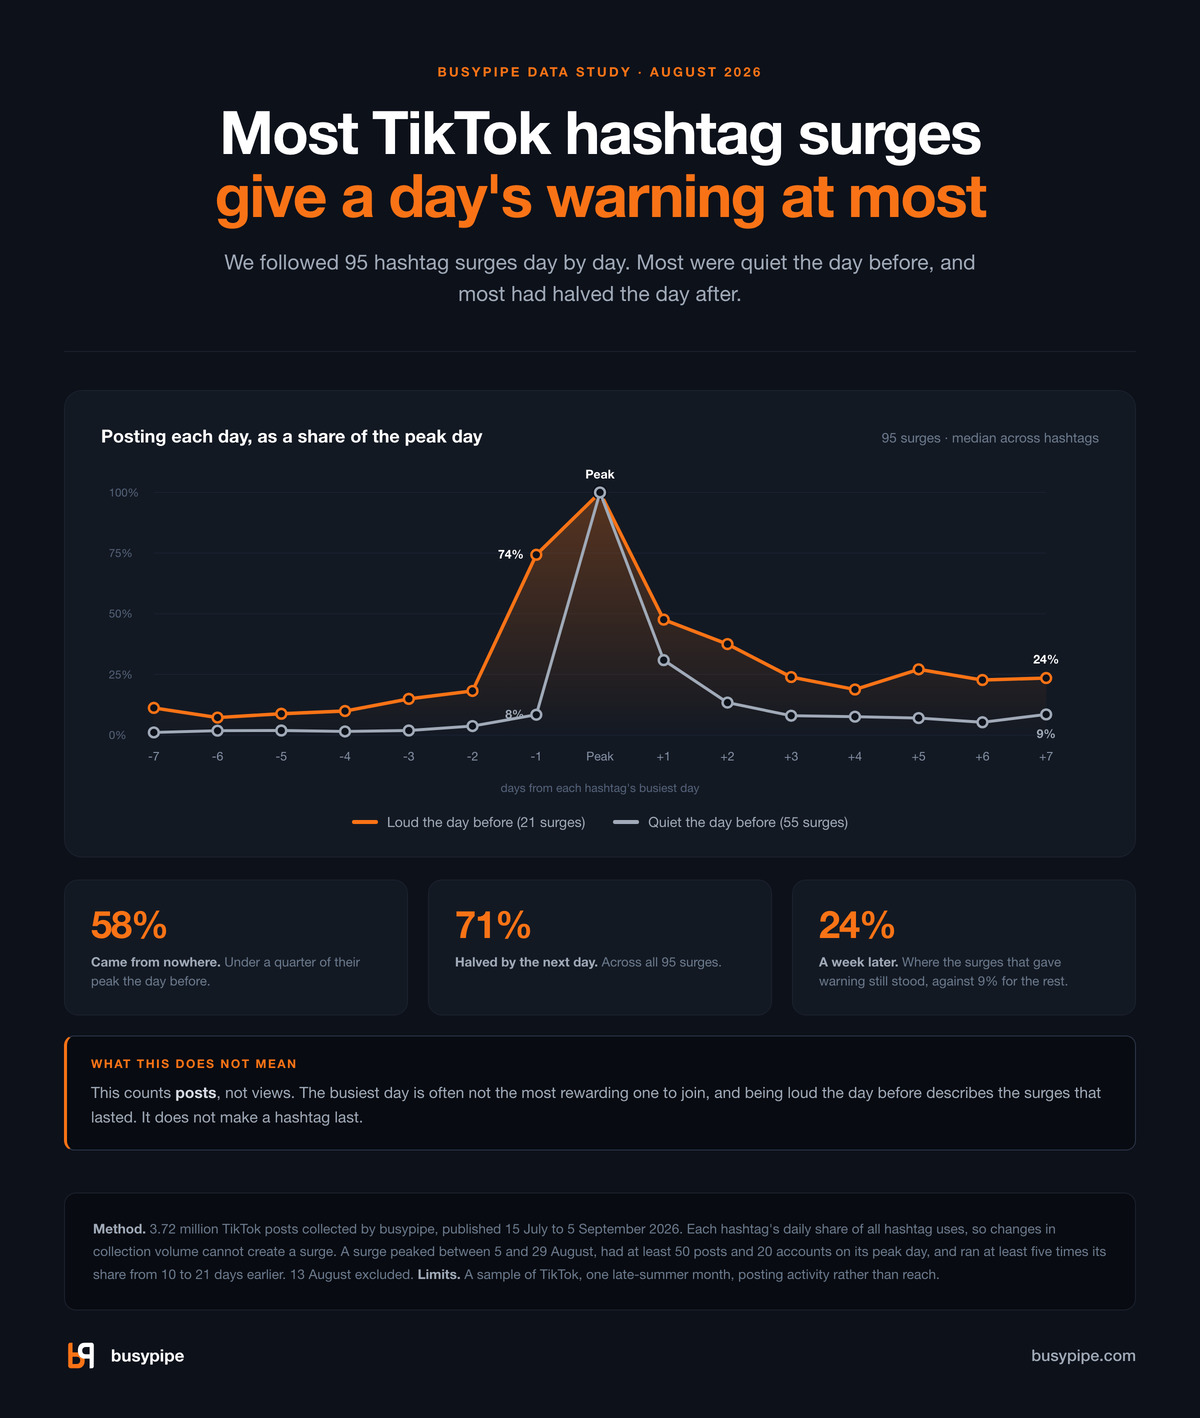
The typical surge, day by day
Here is the median surge, with posting on each day shown as a share of its busiest day.
| Days from peak | −5 | −3 | −1 | Peak | +1 | +3 | +7 |
|---|---|---|---|---|---|---|---|
| All 95 surges | 6% | 8% | 20% | 100% | 36% | 11% | 9% |
Five days before its peak, the typical surging hashtag was posting at 6% of the level it was about to reach. Three days before, 8%. Even the day before, only a fifth. Then it peaked, and the next day it was back to about a third.
Two figures put that in perspective:
- 71% of these surges had halved by the next day, and 78% were below a quarter of their peak by the third day after.
- The peak day and the day after carried 44% of all the posting in the fifteen days around the peak. The whole week before carried 26%.
“It moves fast” is what every trend guide says. This is what fast means: for most surges, the window is a day or two, and most of the build-up happens in the last 24 hours.
Two kinds of surge
The median hides a split. We sorted the 95 by how busy each hashtag already was the day before its peak.
| Days from peak | −5 | −3 | −1 | Peak | +1 | +3 | +7 |
|---|---|---|---|---|---|---|---|
| Loud the day before (21) | 9% | 15% | 74% | 100% | 48% | 24% | 24% |
| Quiet the day before (55) | 2% | 2% | 8% | 100% | 31% | 8% | 9% |
The remaining 19 fall between the two groups and are left out of this table.
58% arrived out of nowhere. The day before its peak, a hashtag in this group was below a quarter of its eventual peak, with a median of 8%. Three days out it was at 2%, which in practice is invisible.
22% were already loud the day before, at three quarters of their peak. These are the ones you could have seen coming, and they are the ones that lasted. A week after the peak they were still posting at about a quarter of their peak level, against under a tenth for the surges that came from nowhere.
That is the most useful thing in this data. The surges that lasted were the ones already busy the day before they peaked. The ones that burst without a run-up were mostly gone before anyone could make something for them.
Many of them were on the calendar
Reading down the list of surges, a pattern is hard to miss: a good share of them were tied to a date anyone could have known weeks in advance.
- The total solar eclipse on 12 August.
#eclipse,#solareclipseand#sonnenfinsternisall peaked on the day. The day before,#eclipsewas at 9% of its peak, even though the date had been known for years. - Results day.
#gcseand#gcseresultspeaked on 20 August, GCSE results day in the UK, from under a fifth of that level the day before. - Independence days.
#14augustfor Pakistan and#17agustusfor Indonesia, each peaking on its date. - Parents’ days and the like.
#วันแม่for Thai Mother’s Day on 12 August,#diadospaisfor Father’s Day in Brazil on 9 August, and#nationaldogdayon 26 August. - Back to school.
#firstdayofschooland the German#allesfürdieschule, both in August as schools went back.
These dated moments fall in both groups. The eclipse, results day and National Dog Day came from almost nothing the day before. Pakistan’s independence day, Thai Mother’s Day and the back-to-school tags were already loud, because the celebrating starts the evening before, or because schools go back on different days. Either way, the data gave a day’s notice at most.
We did not classify all 95 surges, so we are not putting a number on how many were dated. But the pattern is clear enough to act on. For a dated moment, the warning is the calendar, not the data. By the time posting starts to climb, you need your post ready.
Much of the rest looks like news: earthquake-related tags in Spanish (#terremoto, #sismo, #temblor) on 10 and 11 August, and a handful of celebrity names spiking on stories we will not guess at here. Those cannot be planned for. If you cannot post within hours, let them go.
What this does not tell you
- Posting is not reach. We measured how many posts used a hashtag each day, not how many people saw them. In our hashtag surge case study, reach per post fell by almost half while posts flooded in. The busiest day is often not the most rewarding one to join.
- It is a sample of TikTok, not all of it. These are posts busypipe collected, roughly 56,000 to 80,000 a day. A surge in our sample is a surge in TikTok’s activity as we observe it, not a count of every post.
- One late-summer month. The peaks all fall between 5 and 29 August 2026. August is heavy on holidays, results days and back-to-school, which may make calendar-driven surges look more common than they are the rest of the year.
- Loud-the-day-before is a description, not a cause. It separates surges that lasted from ones that didn’t. It does not make a hashtag last, and some loud-the-day-before surges were news stories that broke the previous evening.
How to spot one early
- Put the dates in a calendar. Holidays, results days, launches, releases, sporting finals, in every market you post to. For these, early means having the post ready before the day, because the data gives a day’s notice at most.
- Favour a hashtag that has been building over one that appeared overnight. A one-day spike is usually over by the time you see it. In our data, the surges that were already busy the day before their peak were still at about a quarter of it a week later. We sorted those groups after the fact, so treat this as a pattern to watch for, not a forecast.
- Skip sudden spikes you cannot answer the same day. The typical one had fallen to about a third by the next day and a tenth three days later.
- Watch what travels with a rising hashtag. When a tag starts to climb, look at the smaller tags that appear alongside it and track them too, so you see their next move as it happens. Our guide to TikTok hashtag analytics covers how to read those neighbours.
This is what busypipe is built to show. The Viral view on the Trends page lists hashtags gaining traction fast in each country. Your dashboard’s portfolio pulse flags the tracked hashtags that are rising or falling compared with the weeks before. Each hashtag page shows the tags that travel with it. You can see real trending hashtags by country, refreshed daily, with no sign-up at busypipe.com/demo, and it works on your phone.
Methodology
- What we measured. Every hashtag used on 3,720,855 TikTok posts busypipe collected that were posted between 15 July and 5 September 2026: 1.45 million distinct hashtags. For each hashtag and day we took its share of that day’s hashtag uses, so that changes in our own daily collection volume cannot create a surge.
- What counts as a surge. A hashtag whose busiest day fell between 5 and 29 August, carried at least 50 posts in our sample on its peak day, and ran at least five times its average share from 10 to 21 days earlier. That gives every surge a baseline and a full week either side. Of 1,028 hashtags that reached 50 posts on any day, 95 qualified.
- Breadth. Every surge had at least 20 distinct accounts posting on its peak day, and no hashtag in the set had most of its peak-day posts from a single account.
- What we excluded. 13 August. About two dozen gaming and anime hashtags peaked that day with near-identical counts, which looks like one batch of posts carrying many tags rather than two dozen separate trends. Keeping them would have made the sudden group look larger.
- The groups. “Loud the day before” means at least half the peak level on the previous day. “Quiet the day before” means under a quarter. All figures are medians across surges, day by day, so a column is not one hashtag’s curve.
- The honest caveats. Posts are dated by when they were published, and our collection of any given day keeps filling in for a while afterwards, so we stopped at 5 September. The examples above are named because their dates are public. We did not classify every surge by cause. This is one month of one platform, sampled, and it measures posting activity, not views.
Spot rising sounds before they peak
busypipe tracks trending sounds, creators, and hashtags on TikTok. Every account starts with a 14-day Professional trial — no card required.
Start for freeGet the weekly TikTok trends digest
Rising hashtags, sounds, and creators — straight to your inbox.
Keep reading
-
We watched a TikTok hashtag fill up
A film release pushed one hashtag from 291,000 posts to 2 million in twelve weeks. We tracked it the whole way, and reach per post fell 47% while the posts kept arriving.
-
What is a good TikTok engagement rate?
We measured 1.37 million TikTok videos. Median engagement is 7.5% by views, but it runs from 5.9% to 9.7% depending on how far the video travelled.
-
How to find trending sounds on TikTok
A practical guide to finding trending TikTok sounds early — using TikTok's own tools, smart search, creator watching, and analytics to catch audio before it peaks.